Plotting Phase Portrait for Nonlinear Damped Pendulum for larger damping
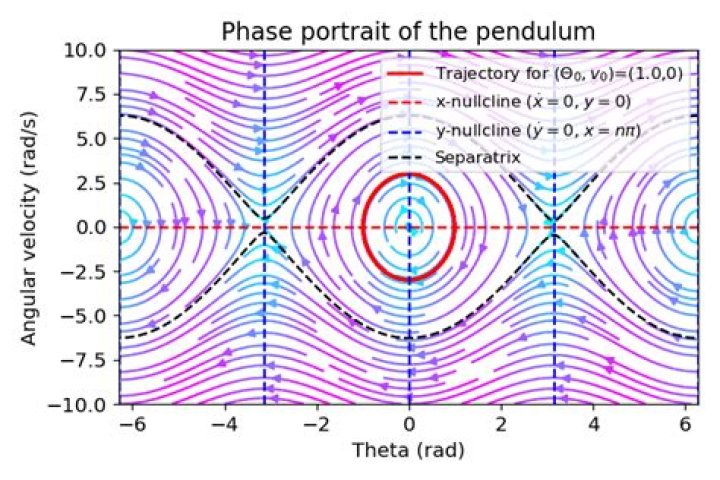
I'm asked to sketch the phase diagram near the equilibrium points of the nonlinear damped equation:$x ^ { \prime \prime } + k x ^ { \prime } + \sin x = 0$.
I've found that for any integer $n$, $( n \pi, 0)$ is a solution the above equation. I've classified the type of equilibrium points depending on whether $n$ is odd or not.
The problem is that I have given three cases to consider while sketching the phase portrait:$(1) \ k \in (0,2), \ (2) \ k = 2, (3) \ k > 2$. For the first case, I know that since damping is small we can define $H ( x , y ) = \frac { 1 } { 2 } y ^ { 2 } - \cos x$. Then we can sketch the phase diagram. However, in the cases $(2),(3)$, where damping is not so small, what can we do to sketch the diagram?
$\endgroup$ 2 Reset to default