How to find the graph of $e^{2x}$ and $\ln y$
I'd like to know how find the graph I just only know how to draw the common function graph as circle or ellipse but I don't know how to draw.
For example $e^{2x}$ and $\ln y$.
Note:the interval for $e^{2x}, \;[0,\ln 2].$ How can I determine $\ln 2$ on the graph?
It's better if somebody help me to find resource to learn more about graph -online please
Thanks all
$\endgroup$ 32 Answers
$\begingroup$So $y = e^{2x} $ is a function: it takes values of $x$ as input, and outputs the function value $y = e^{2x}$.
Here, we have that the interval $[0, \ln 2]$ defines the domain of $x$, for the purposes of your graph.
$\ln 2 \in \mathbb R$ is a constant, and defines an endpoint of the domain in question.
Note that $y = e^{2x}$ at $x = \ln 2$ outputs $ e^{\large 2\cdot \ln 2} = e^{\large \ln(2^2)} = e^{\large \ln 4} = 4$.
So you can plot the "end points" of your graph: $(0, e^{2\cdot 0}) = (0, 1)$, and the point $(\underbrace{\ln 2}_{x}, \;\underbrace{e^{2\cdot \ln 2}}_{y}) = (\ln 2, 4)$.
Note that $\ln 2 \approx .6931$.
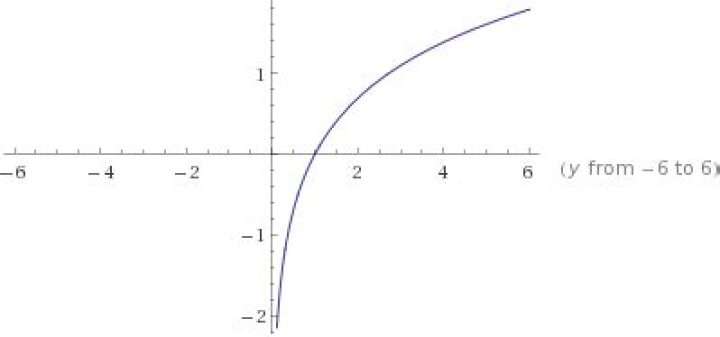
We also have the function $f(y) = \ln y$, and in this case, we have that the function depends on the input value of $y$, which are all real values greater than zero. So here, we consider the ordered pairs $(y, \ln y)$, and obtain the plot (blue graph):
For a handy on-line graphing resource, feel free to explore with Wolfram Alpha, which I used to obtain the graphs posted above, and also use as a calculator. It is quite powerful, for you purposes!
You'll also want to start developing some intuition on the shapes of the most important functions, two of which are $f(x) = e^x$ and $f(x) = \ln x$. The best way to develop such an intuition is through practice: graphing by hand, and graphing using a graphing calculator and/or an on-line resource! Good luck!
$\endgroup$ 3 $\begingroup$You should know the graph of $y=e^x$. Then, the graph of $y=e^{2x}$ is the 'shorten' graph of $y=e^x$ in the direction of the $x$ axis . You'll see the both graphs here.
Also, note that $e^0=1, e^{2\ln 2}=4$, which means the graph of $y=e^{2x}$ passes the two points $(0,1),(\ln 2, 4).$ However, we don't know the exact value of $\ln 2\approx0.693.$ see here.
$\endgroup$ 2