How to connect datapoints in a scatter plot in Excel?
I have been trying to add straight lines for each set of the data points, and have tried to change the chart type.
However, even I changed it to 'scatter with straight lines and markers', there is still no lines at all.
So how can I add lines to connect the datapoints?
1 Answer
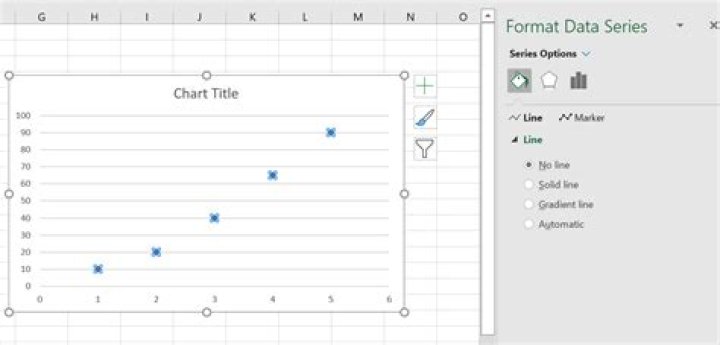
In the chart, select a data series (by clicking, but not double-clicking, on one of its points) and then right click. Select "Format Data Series" from the context (popup) menu that appears. Depending on your version of Excel, a dialog will appear that allows you to add lines to the data series.
In the latest versions, it will look like this:
Simply select the "solid line" radio button and more dialog will appear which will allow choice of colour, line style, line thickness, etc. Repeat for any other series similarly without lines on your chart.
It is possible that whatever method you used to create your original chart specifically set the line property to be "No line" for each of the series in your chart and that these settings remained in effect despite you changing the chart type to "scatter with straight lines and markers".