How do I create a histogram chart in Excel with class interval bins?
I am trying to create a histogram to show the full set of 100 compensations using class intervals (i.e. bins) of width 4 (0-4, 4-8, etc.)
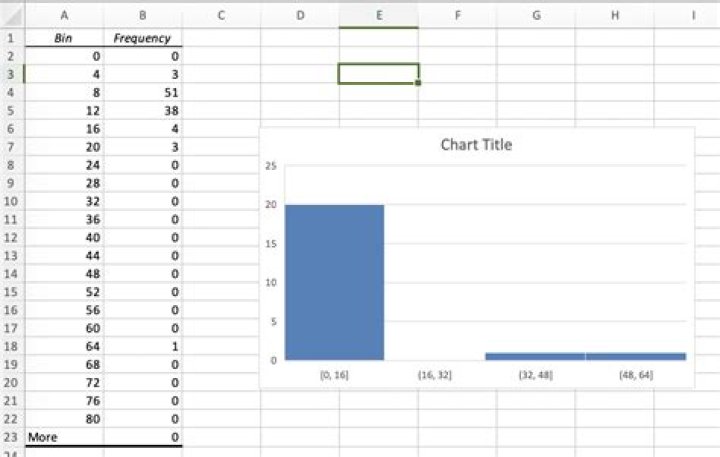
However, after using Data Analysis->Histogram to create the graph, I can't figure out how to change the bins to be of width 4 instead of 16.
What it looks like now:
1 Answer
There's at least two ways around this, two that I know are described below.
- When you're creating your histogram the first field is to introduce the input range of your data. The second field allows you to define a list with the bin sizes.
- After you've created a histogram, right-click on the X axis and Click on Format-axis. You can then define the bin size as well.