How can you visualize Independence with Venn Diagrams?
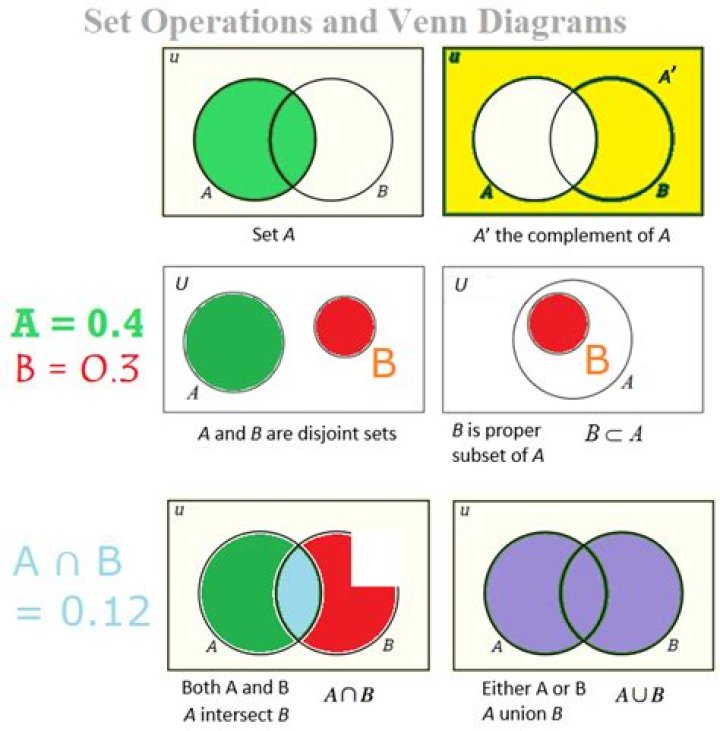
Imagine two events $A$ and $B$ that are not mutually exclusive, such that $P(A) = 0.3$ and $P(B)=0.4.$ Consider the Venn diagram of the two overlapping sets, and visualize moving them closer together or further apart, thus varying the size of the overlapping region $A \cap B$. It should be $\color{darkorange}{\text{clear}}$ that $P(A \cap B)$ could take on any value between $0$ and $0.3$, but of that infinite set of possible values, the only one that would make $A$ and $B$ independent would be $P(A \cap B) = 0.12.$
After reading this answer (excerpted above), I drew Venn diagrams below for $P(A \cap B) =0$ (when $A$ and $B$ are disjoint), $P(A \cap B) =0.12,$ and for $P(A \cap B) =0.3$ (when $B \subsetneq A)$.
However, it is $\color{darkorange}{\text{not clear}}$ to me that the only one that would make $A$ and $B$ independent would be $P(A \cap B) = 0.12$. I still can't intuit or visualize independence.
2 Answers
$\begingroup$It's not feasible to represent independence. Most people think drawing Venn Diagrams that are disjoint demonstrates independence, but that is false. If two events are disjoint, they are inherently dependent. Because if I know A occurs, I know B cannot occur and vice versa.
So what about the opposite: drawing Venn Diagrams that intersect? This method isn't quite useful for visualizing independence either. For example, let A be the event Susan studies for her test and let B be the event Susan eats chocolate. The intersection in the Venn Diagram means that Susan studies for her test and she eats chocolate. Let's say these two events are independent. That doesn't mean these two events can't co-occur, i.e. intersect. They can. Likewise, let's say the events are dependent. They can still co-occur or not co-occur. So there, we have shown that we can't demonstrate independence via intersection either.
$\endgroup$ $\begingroup$In the above universe, $a,b,c$ and $d$ denote probabilities. \begin{align}&\text{events }X \text{ and } Y \text{ are }\textbf{independent} \\\iff &P(X\cap Y)=P(X)P(Y) \\\iff &\frac{c}{a+b+c+d}=\frac{b+c}{a+b+c+d}\times\frac{c+d}{a+b+c+d} \\\iff &ac=bd.\end{align}
Imagine two events $X$ and $Y$ that are not mutually exclusive, such that $P(X) = 0.3 \,$ and $P(Y)=0.4.$ Consider their Venn diagram.
It should be clear that the only value of $P(X \cap Y)$ that makes $X$ and $Y$ independent is $P(X \cap Y) = 0.12.$
$$b=0.3-c\tag1$$$$d=0.4-c\tag2$$$$a=1-0.3-(0.4-c)=0.3+c\tag3$$
For events $X$ and $Y$ to be independent, $$ac=bd\tag4.$$
Solving $(1),(2),(3),(4)$ gives $$c=0.12,$$ as required.
Independence of events is not straightforward to intuit from Venn diagrams (unlike mutual exclusivity, which is observed by inspecting their intersection).
For example:
$$ \begin{array}{r} \begin{array}{c|c|c} \style{font-family:inherit}{} & \style{font-family:inherit}{U_1} & \style{font-family:inherit}{U_2} & \style{font-family:inherit}{U_3} \\\hline \style{font-family:inherit}{P(X\cap Y)} & 0 & \frac14 & \frac14 \\[0pt]\hline \style{font-family:inherit}{P(X)P(Y)} & \frac14\times\frac12=\frac18 & \frac14\times\frac34=\frac38 & \frac12\times\frac12=\frac14 \\[0pt]\hline \style{font-family:inherit}{\therefore X\text{ and }Y\text{ are}\ldots} & \textbf{dependent} & \textbf{dependent} & \textbf{independent} \end{array}\hskip-5.5pt \end{array} $$[Universe $U_1$ above is also an example of the fact that for events with nonzero probabilities, $\big(\text{mutual exclusivity}\implies\text{dependence}\big)$.]
Two more examples, but involving $3$ events: in each case, events $A,B$ and $C$ are pairwise independent yet not (mutually) independent $\big($since $P(A \cap B\cap C) \neq P(A)P(B)P(C)\,\big):$
When the probability experiment has just $2$ trials, a table like this is a good way to understand/visualise conditional probability as working in a reduced sample space:$$ \begin{array}{r} \begin{array}{c|c|c} \style{font-family:inherit}{\text{time of complaint}\bigg\\ \text{reason for complaint}} & \style{font-family:inherit}{\textbf E\text{lectrical}} & \style{font-family:inherit}{\textbf M\text{echanical}} & \style{font-family:inherit}{\textbf L\text{ooks}} \\\hline \style{font-family:inherit}{\textbf D\text{uring guarantee period}} & 18\% & 13\% & 32\% \\[0pt]\hline \style{font-family:inherit}{\textbf A\text{fter guarantee period}} & 12\% & 22\% & 3\% \end{array}\hskip-5.5pt \end{array} $$The calculation (notice that the figure ‘$32$’ was obtained from the intersection of column $L$ and row $D$) $$P(L|D)=\frac{P(L\cap D)}{P(D)}=\frac{32}{18+13+32}=51\%\neq32\%+3\%=P(L)$$ shows that $L$ and $D$ are dependent events.
$\endgroup$ 1