Can you make it so a chart color gradient color changes with a cell value?
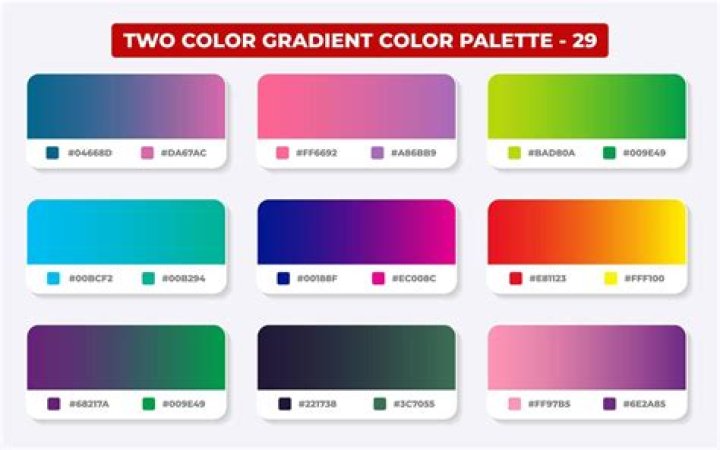
I am curious if it is possible to make a two colored gradient bubble to have its colors dependent on cell values / colors.
I have a bubble graph where I want to have each bubble two different colors via a gradient. Each half of the bubble color is dependent on the color of a cell. It would make for less errors if the colors of the bubbles were autofilled based off the color in two cells.
Is something like this possible to do?