Can anyone explain the average case in insertion sort?
I am not sure if this question is off topic or not but a question like this has been asked on this site before - Insertion sort proof
Here is an example of insertion sort running a on a set of data
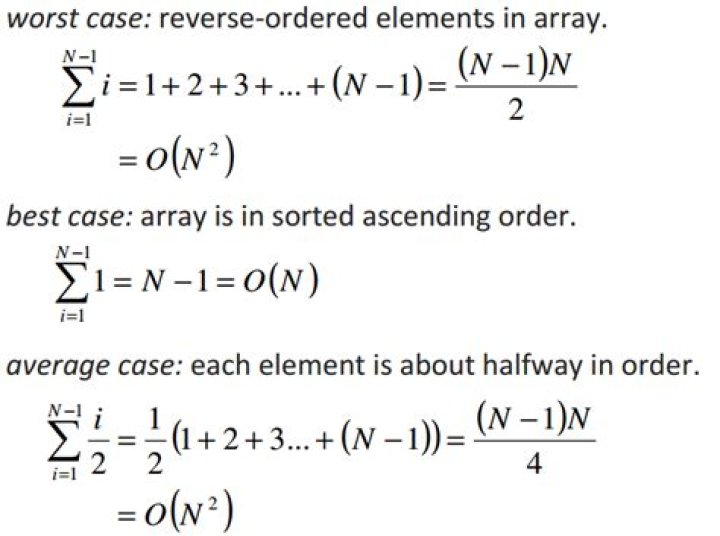
Here is the instructor's runtime proofs for the different cases (slide 10)
Can anyone explain the intuition behind the i/2 in average case? I get worst case(number of comparisons = element number) and the best case(everything in order, 1 comparison per element).
$\endgroup$ 42 Answers
$\begingroup$Reading through the slides I noticed the insertion sort implementation discussed here is actually sub-optimal: An element is swapped into place in a bubble-sort like manner. Since the sorted list at step $i$ has $i$ elements, the average number of comparisons (= swaps - 1) needed to sort the $i+1$-st element into place is $$\frac12(1_{\text{element is in place}} + i_{\text{element is smallest yet}})$$ So actually the correct average case estimate would be $$\sum_{i=1}^{N-1} \frac{i+1}2 = \frac{(N-1)N}4 + \frac{N-1}2 = \frac{(N-1)(N+2)}{4}$$ But this is also $\mathcal O(n^2)$ so that's a minor mistake.
$\endgroup$ $\begingroup$The intuition relies on the fact that for every position in the array on an average half the elements are greater than the number in that position, and hence they will contribute to a comparison.
$\endgroup$