Can't edit horizontal (catgegory) axis labels in excel
The horizontal (category) axis labels editor aren't clickable on my excel scatterplot. How can I fix this?
2 Answers
In a scatter chart, each series has its own X and Y values, and they are plotted as numbers along the X and Y axes.
In other chart types (line, column, area), all series share the X values (or category labels).
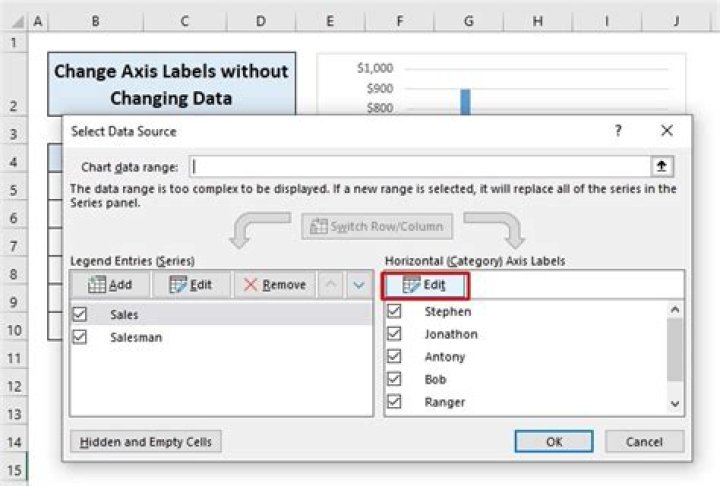
In the Windows version of this dialog, for a scatter chart, the X and Y data range boxes are visible, and the horizontal axis labels box is not. The screenshot you show looks like Excel 2011 for Mac, and the dialog is confusing because it shows the boxes for both X values and X labels.
I FIGURED THIS OUT! It took me hours to figure this out. Hopefully, this will help someone else not spend hours on something so ridiculous.
I'm using Excel 2013. Like in the question above, when I chose Select Data from the chart's right-click menu, I could not edit the horizontal axis labels!
I got around it by first creating a 2-D column plot with my data. Next, from the chart's right-click menu: Change Chart Type. I changed it to line (or whatever you want). Voila, horizontal axis labels are mysteriously available.